Run AutoML on random data - seeking signal in the data
Have you ever consider using Machine Learning and wasn't sure about it? Would you like to know when using Machine Learning is justified? Would you like to know how to check if there is a 'signal' in your data? I've trained AutoML on random data an present results here to help you get a better ML understanding when to use ML and how good is your data.
All experiments results and code is available at GitHub.
The experiment
I've generated 3 datasets with random data. Each has 10 columns and 1k, 5k, 10k of rows. The target for each dataset is a random vector of {0, 1} - so a binary classification problem. I've used mljar-supervised AutoML python package. I run AutoML in Explain mode and feature_selection=True. The AutoML will train:
Baseline(returns the most frequent class as prediction),Decision Tree,Linearmodel (aka Logistic Regression),Random Forest,Xgboost,Neural Network,Ensemble.
AutoML will train above algorithms with default hyperparameters on 75%/25% train/test data split. Additionally, full explanations will be produced for all models.
The code
The code to run the experiment is simple:
- generate random data,
- run the AutoML.
import numpy as np
from supervised import AutoML

COLS = 10

for ROWS in [1000, 5000, 10000]:
    X = np.random.uniform(size=(ROWS, COLS))
    y = np.random.randint(0, 2, size=(ROWS,))

    automl = AutoML(results_path=f"AutoML_{ROWS//1000}k", mode="Explain", features_selection=True)
    automl.fit(X, y)
For each AutoML run there is a directory with all results: [AutoML_1k, AutoML_5k, AutoML_10k].
Result for 1k random data
The table with models:
| Best model | name | model_type | metric_type | metric_value | train_time | Link |
|---|---|---|---|---|---|---|
| 1_Baseline | Baseline | logloss | 0.692639 | 0.17 | Results link | |
| 2_DecisionTree | Decision Tree | logloss | 0.79591 | 9.32 | Results link | |
| 3_Linear | Linear | logloss | 0.696153 | 5.83 | Results link | |
| 4_Default_RandomForest | Random Forest | logloss | 0.693047 | 7.18 | Results link | |
| 5_Default_Xgboost | Xgboost | logloss | 0.687018 | 3.86 | Results link | |
| 6_Default_NeuralNetwork | Neural Network | logloss | 0.693683 | 4.75 | Results link | |
| 5_Default_Xgboost_RandomFeature | Xgboost | logloss | 0.684524 | 0.93 | Results link | |
| 6_Default_NeuralNetwork_SelectedFeatures | Neural Network | logloss | 0.695517 | 4.56 | Results link | |
| 4_Default_RandomForest_SelectedFeatures | Random Forest | logloss | 0.696178 | 5.78 | Results link | |
| 5_Default_Xgboost_RandomFeature_SelectedFeatures | Xgboost | logloss | 0.686194 | 1 | Results link | |
| the best | Ensemble | Ensemble | logloss | 0.683784 | 0.77 | Results link |
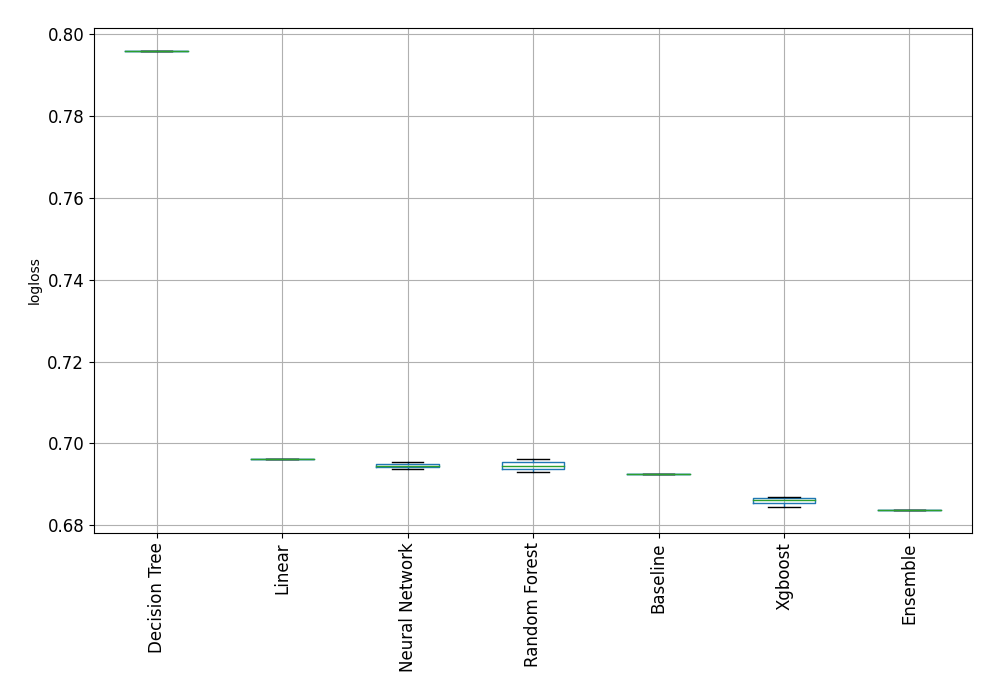
Results plotted:

Compare algorithms
The first red flag - the
Baseline model is much better than Decision Tree, Linear, Neural Network and Radnom Forest! The constant prediction is better than complex Machine Learning algorithms. Something is wrong ...
The percentage improvement
The % difference between the best model (Ensemble) and Baseline:
% difference = (0.6926 - 0.6837) / 0.6926 * 100.0 = 1.28%
The best ML model is only 1.28% better than simple baseline which predicts always the most frequent class (for example, always returns 1). The second red flag - the performance improvement of best model over
Baseline is very small. (Personally, I'm using 5% as a threshold to decide if there is some 'signal' in the data).
Learning curves
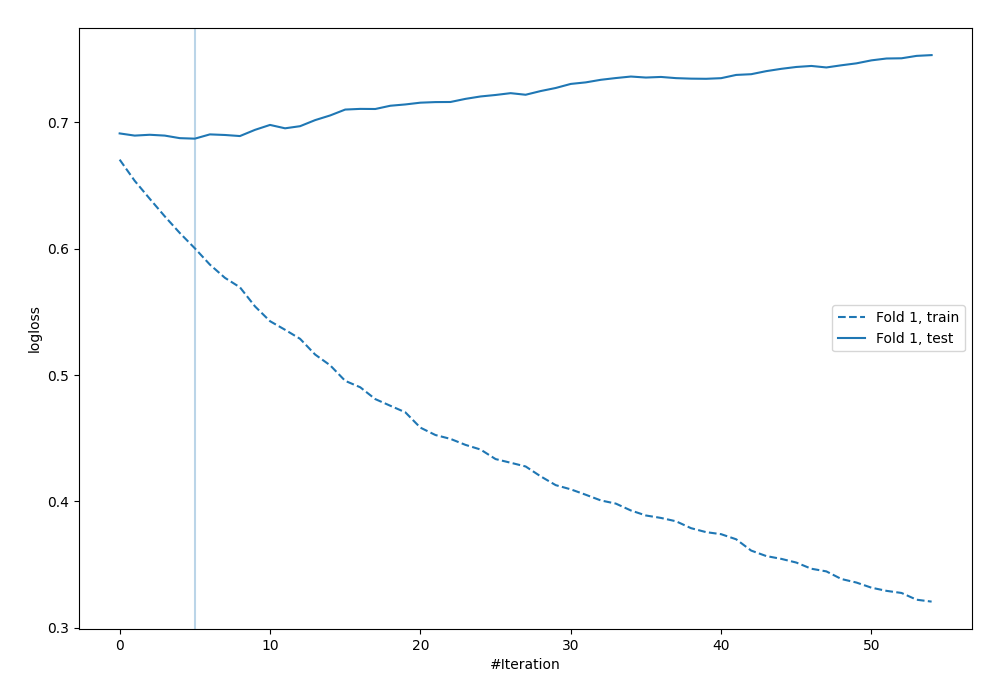
Let's look at learning curves of the Xgboost (model name 5_Default_Xgboost):

Can you see this huge overfit? This plot can be showed at classes as a perfect example of the overfit. The train
logloss is going down and test logloss is going in the opposite direction. The model is starting to overfit very fast (5 trees in the Xgboost) - the third red flag (fast overfitting).
Features importance
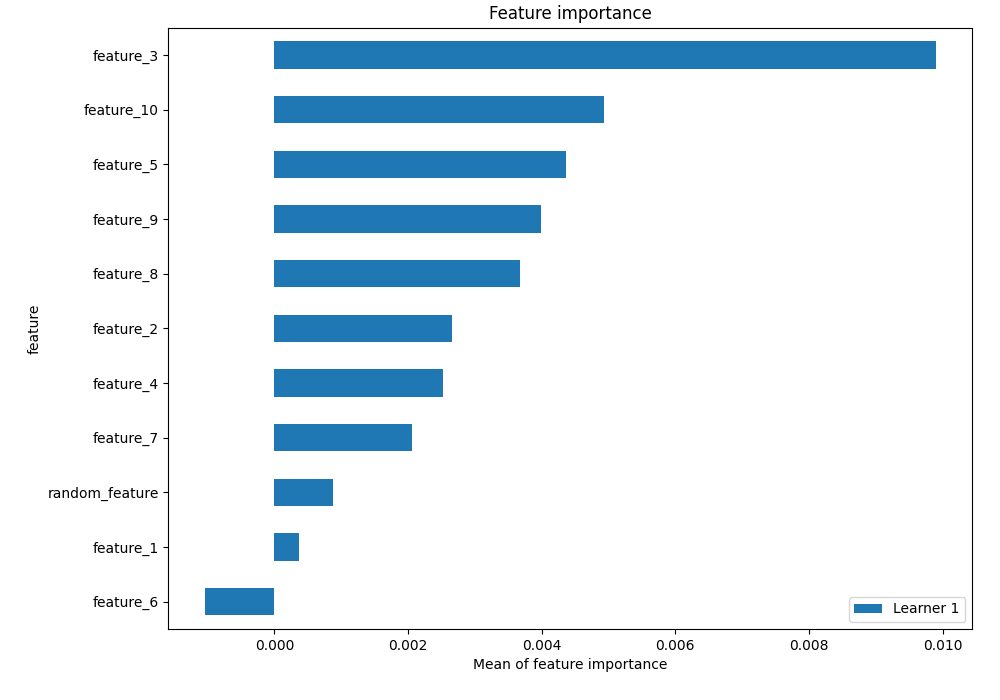
Here is the feature importance for the Xgboost trained with additional radnom_feature:

Just another random feature in the plot ... But you can see how overfitting works: feature_3 is much more important than random_feature.
Result for 5k random data
Results for data with 5k random samples is very similar, except that Baseline was the best performing model!

Result for 10k random data
For 10k samples of random data the feature selection algorithm started to work. All features were less important than injected random_feature:

The AutoML rasied the exception that all data looks like random! (see the errors.md)
Summary
When training Machine Learning models it is always worth to check the Baseline. You will get the intuition about your data and problem that you are solving.
Red flags during training Machine Learning models that warn you that your data might be random (or with some errors):
- The
Baselinealgorithm outperforms complex ML algorithms. - The percentage difference between the best model and the
Baselinemodel is very small (smaller than5%). - Models are overfitting very fast.
- All features are dropped during the feature selection procedure.