Explainability in AutoML
There are three modes of explanations available in mljar-supervised. The explanations are controlled by explain_level parameter in AutoML constructor.
- if
explain_levelis0no explanations are produced. Only learning curves are plotted. - if
explain_levelis1the following explanations are produced: learning curves, importance plot (with permutation method), for decision trees produce tree plots, for linear models save coefficients. - if
explain_levelis2the following explanations are produced: the same as1plus SHAP explanations.
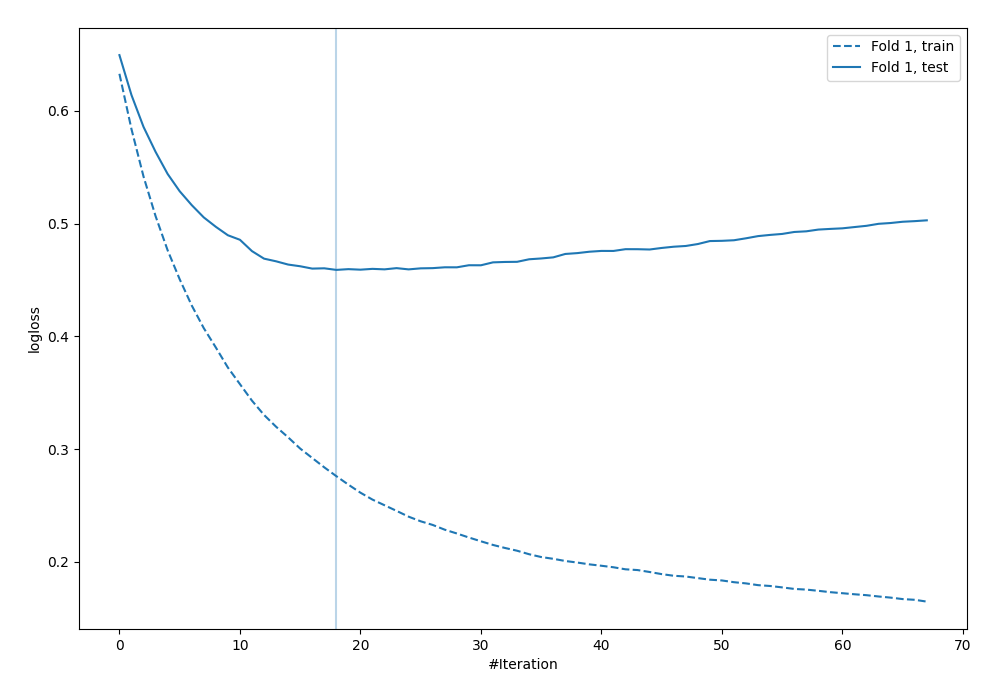
Learning curves
The learning curves show the evaluation metric values in each iteration of the training. The learning curves are plotted for training and validation datasets. The vertical line is used to show the optimal iteration number, which will be later used for computing predictions. Learning curves are always created.
Decision Tree Visualization
The visualization of the Decision Tree is created if explain_level >= 1. The dtreeviz is used to plot the tree.

Linear model coefficients
For the explain_level >= 1 the coefficents of the Linear model are saved in the Markdown report. The example of cofficents is presented below.
| feature | Learner_1 |
|---|---|
| capital-gain | 2.28219 |
| education-num | 0.843846 |
| age | 0.468591 |
| sex | 0.468299 |
| hours-per-week | 0.369091 |
| capital-loss | 0.279562 |
| race | 0.104163 |
| education | 0.0546121 |
| fnlwgt | 0.0545988 |
| native-country | 0.0173909 |
| occupation | -0.00958272 |
| workclass | -0.102386 |
| relationship | -0.154081 |
| marital-status | -0.358737 |
| intercept | -1.51172 |
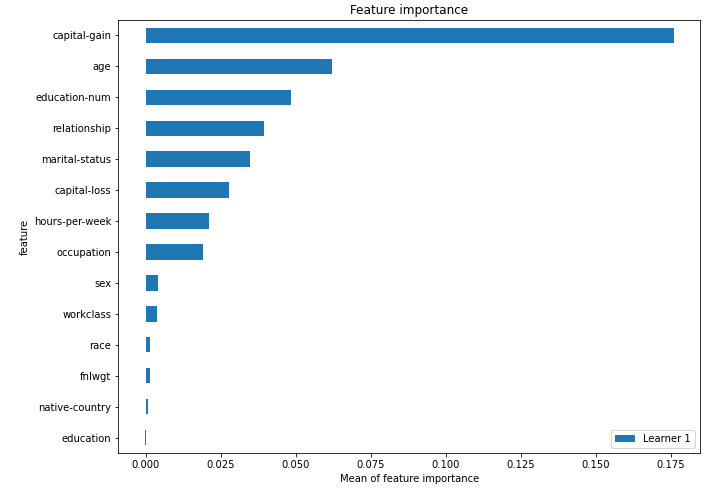
Features Importance
The features importance is computed with permutation-based method (using scikit-learn permutation_importance). The features importance can be computed to any algorithm (except of course Baseline, which doesnt use import features at all). The importance is presented in the plot (top-25 importance features) and saved to the file learner_*_importance.csv for all features. It needs explain_level >= 1.
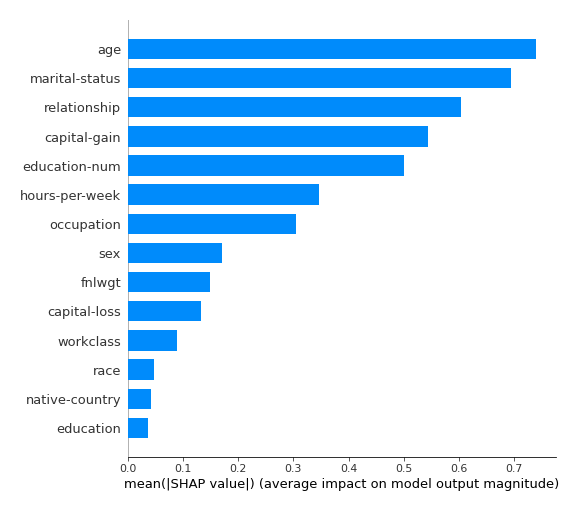
SHAP plots
The SHAP explanations are computed if explain_level = 2. To compute SHAP explanations the shap package is used.
The SHAP explanations are not available for Baseline, Neural Network, CatBoost.
SHAP importance
The SHAP importance example:
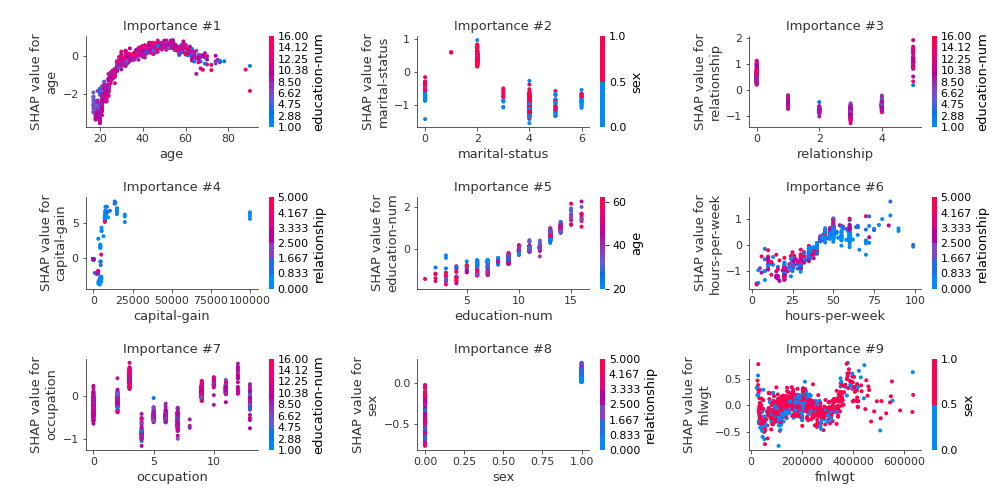
SHAP dependence plots
The SHAP dependence plots example:
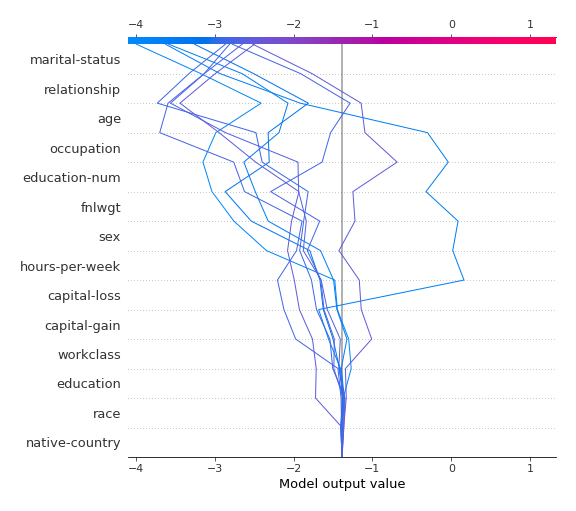
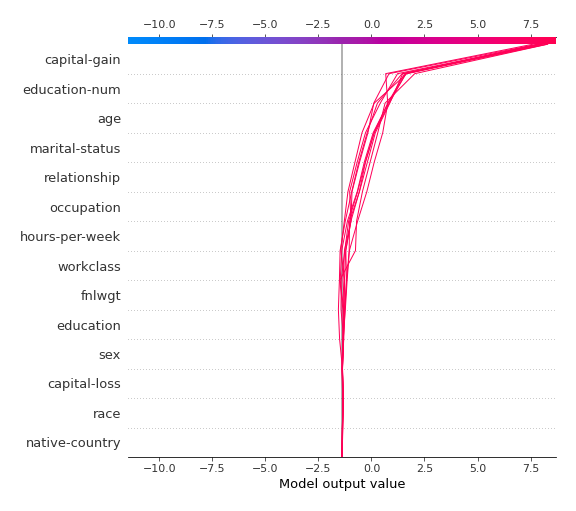
SHAP decision plots
For SHAP decisions plots there are created the top-10 worst and best predictions.
The SHAP decision plots example for the best predictions:
The SHAP decision plots example for the worst predictions: